Debugging your program using Valgrind and CLion on Linux
CLion has a Valgrind integration[1] offering a convenient way to analyse your program with Valgrind and also a nice interface to easily inspect the results.
However, sometimes it’s hard to spot the source of your problem only by looking at Valgrind reports: Ok, I’m accessing a Dangling pointer on this method. But, what instance of my class is actually causing the problem? If only I could set a breakpoint where the invalid read happens….
Fortunately, it’s possible to debug a program running under Valgrind[2]. The bad news is that CLion does not support this feature out of the box. But don’t worry, it’s not hard to properly configure CLion to be able to do this.
In this post I’ll show you how you can configure the CLion debugger to debug a program running under Valgrind. Only a few steps are required.
Configure Valgrind on CLion[1]
To be able to use Valgrind with CLion we first need to install it:
sudo apt-get install valgrind
Now we need to configure CLion to launch Valgrind in vgdb mode. In vgdb mode, Valgrind will start a gdbserver debugging our program under Valgrind.
Open CLion settings and navigate to Build, Execution, Deployment > Dynamic Analysis Tools > Valgrind.
Append the following options to the existing Analysis options:
--vgdb=yes --vgdb-error=0
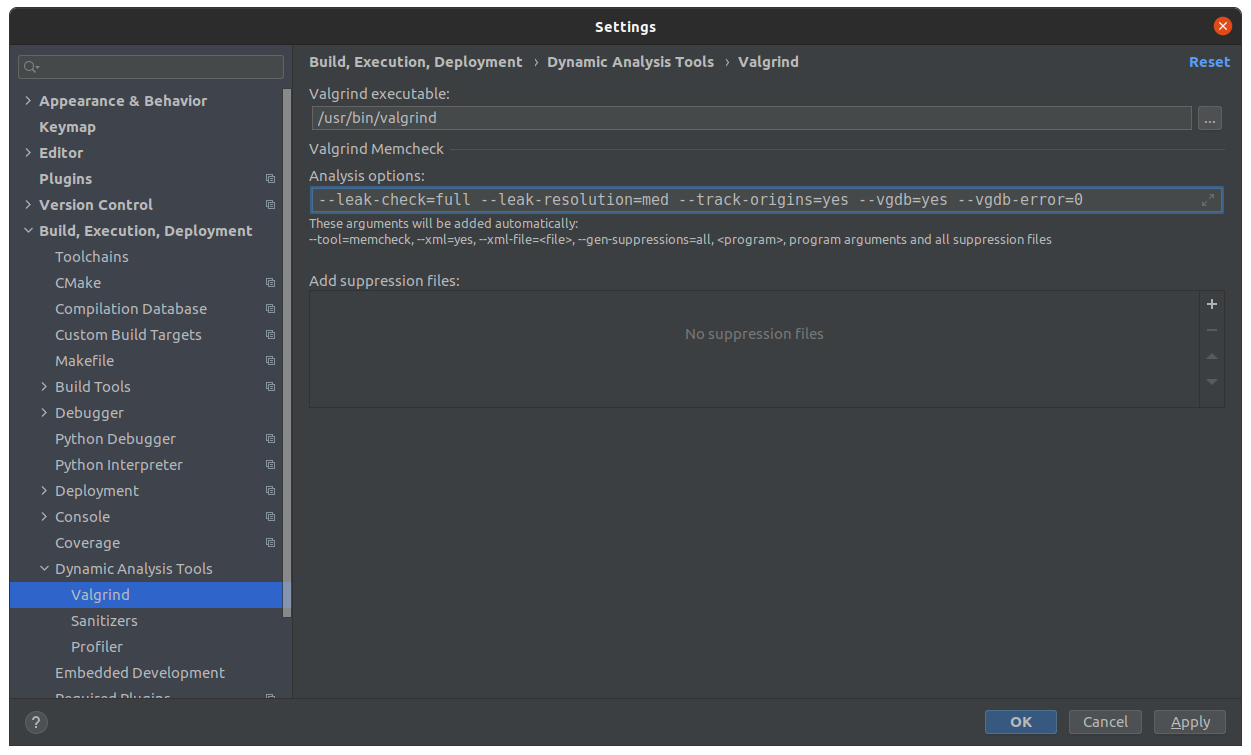
--vgdb=yes enables the Valgrind gdbserver. --vgdb-error=0 tells Valgrind to pause the debugging session so we have time to launch a remote gdb session as described below.
Create a CLion configuration to debug the Valgrind gdbserver[3]
We need to create a CLion debug configuration to connect to the gdbserver that Valgrind will create.
Go to Run > Edit Configurations…
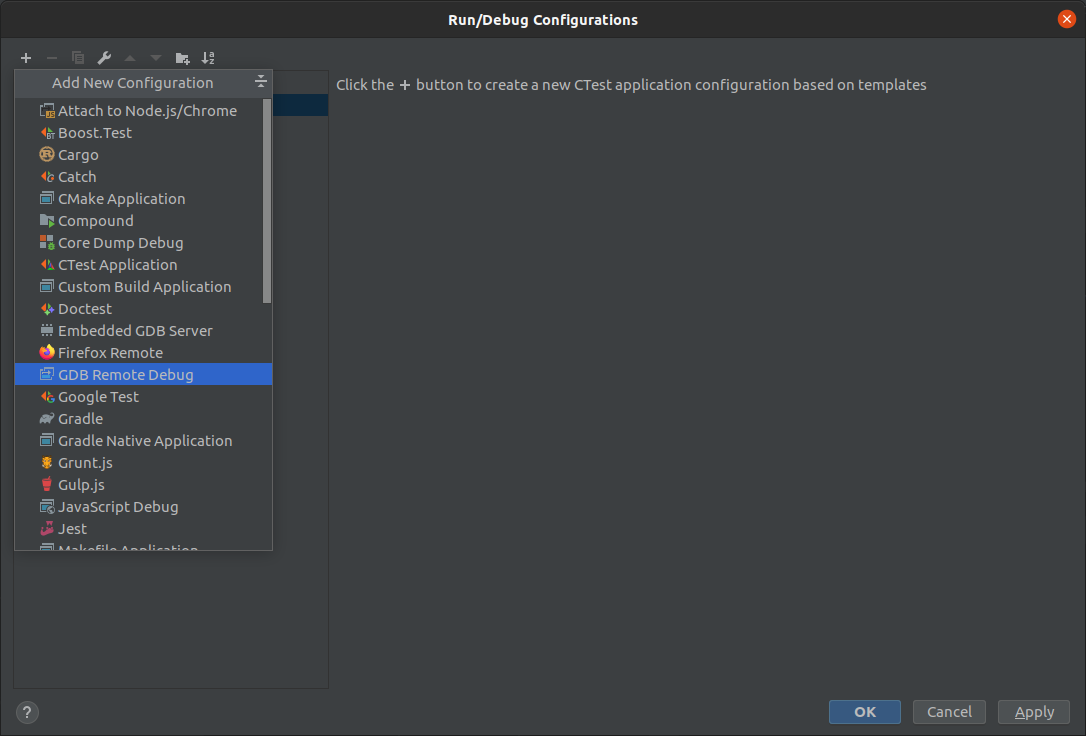
Create a new GDB Remote Debug configuration.
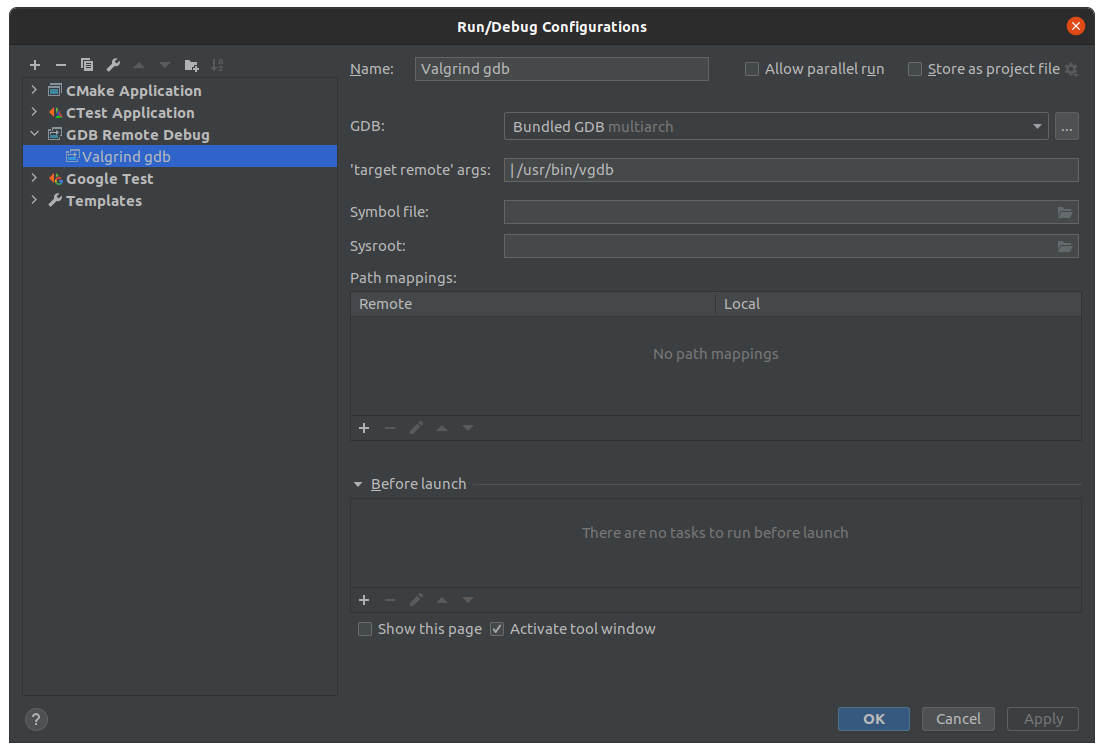
Name the configuration something like Valgrind gdb
On the ‘target remote’ args field write | /usr/bin/vgdb. The pipe character is important[2][4].
Debugging your program under Valgrind
Now you are ready to debug your program under Valgrind.
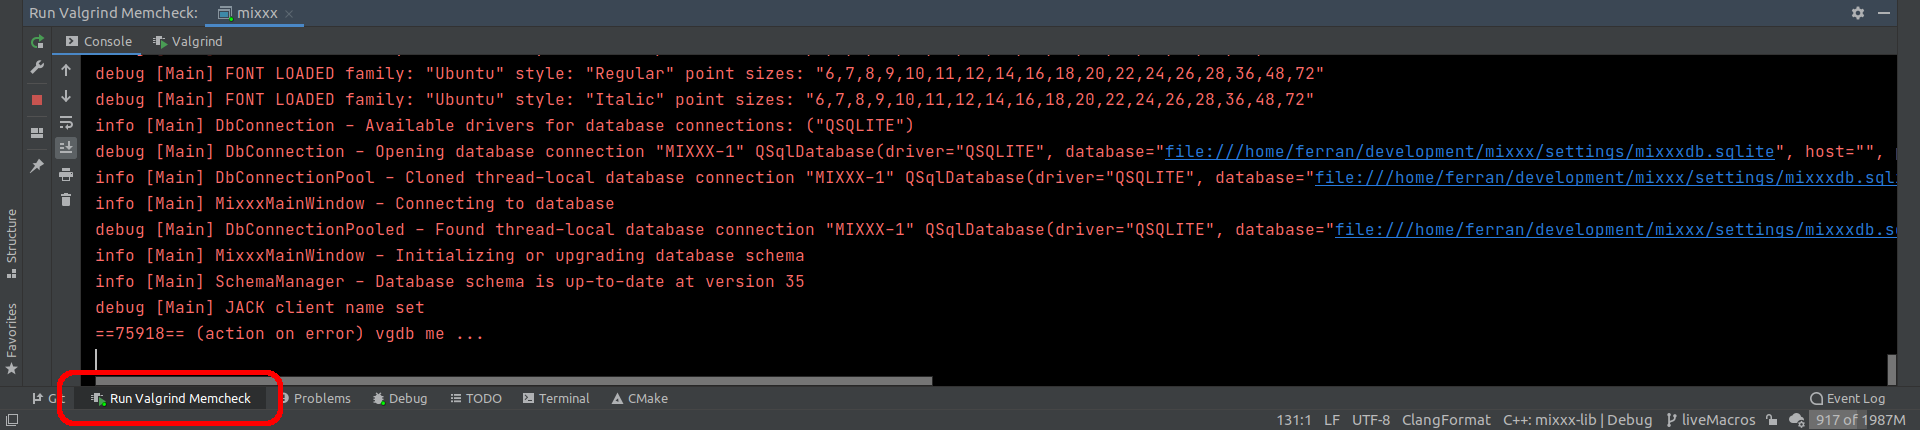
Select the configuration of the program you want to debug and run it with Valgrind memcheck.

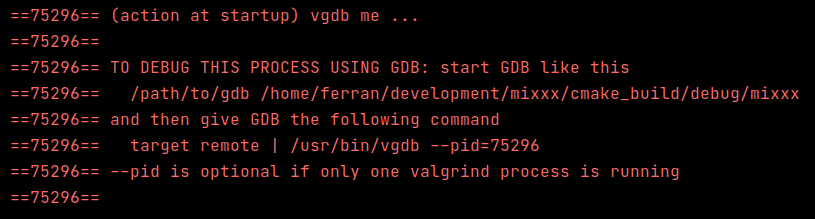
Valgrind now waits for a debugger to connect before starting your program.
Without stopping the valgrind process, select the GDB Remote Debug you created and run it in debug mode.

Now Valgrind will detect that a debugger has connected and it will start your program. On the Run tab you can see the output of the program under analysis. You’ll see there the Valgrind report once the program stops.
On the Debug tab you have your usual debug controls.
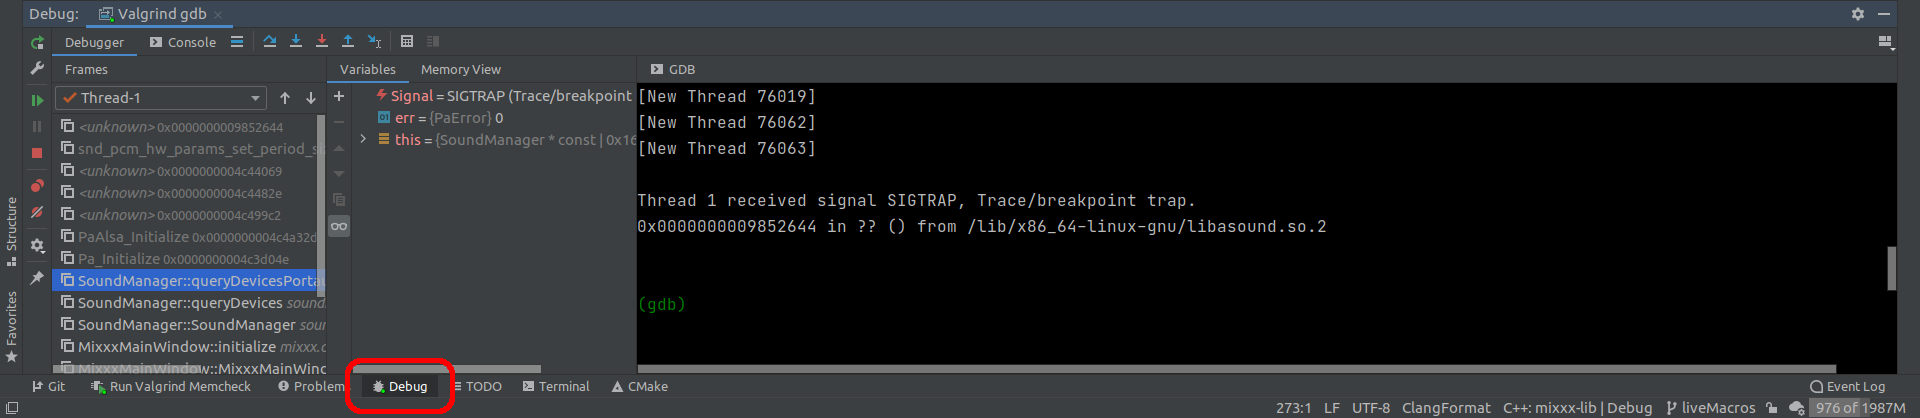
Valgrind will raise a trap signal (SIGTRAP) when it detects a problem. You can then inspect the stack trace, and your usual debugging commands. You can also unleash the power of Valgrind by sending commands to it through CLion’s gdb console[5].
EDIT
CLion won’t display the output of monitor commands sent to Valgrind’s gdbserver.
https://youtrack.jetbrains.com/issue/IDEA-256947
Troubleshooting
Regular Valgrind analysis
We just configured Valgrind to wait for a gdb debugger before starting your program. If you want to run a regular Valgrind analysis without the debugger, you’ll need to edit the CLion Valgrind configuration again and set the vgdb option back to no: --vgdb=no.
Remote communication error
You might encounter the following error when debugging with the GDB Remote Debug configuration:
com.jetbrains.cidr.execution.debugger.backend.gdb.GDBDriver$GDBCommandException: Remote communication error.  Target disconnected.: Connection reset by peer.
Debugger disconnected
Usually the problem is that there are more than one instances of Valgrind running and CLion does not know which one it should connect to.
The easiest solution is to stop all CLion processes, use your operating system task manager to kill any running instances of Valgrind and try again. On an x64 linux computer the process will be named memcheck-amd64-.
If you really need to have several instances of Valgrind running at the same time, you can instruct CLion to connect to a particular one by editing the GDB Remote Debug configuration and appending the pid to the ‘target remote’ args command like this:
| /usr/bin/vgdb --pid=63077
Note that you will need to edit your configuration and change the pid number every time.
For your convenience, Valgrind prints is pid on the console when started in vgdb mode.
References
- CLion Valgrind memcheck (jetbrains.com)
- Debugging your program using Valgrind gdbserver and GDB (valgrind.org)
- CLion GDB Remote Debug (jetbrains.com)
- Connecting to a Remote Target (sourceware.org/gdb)
- Valgrind and GDB: Tame the Wild C (heeris.id.au)